In the dynamic world of forex trading, understanding how to read and interpret forex charts is essential for making informed decisions. Technical analysis, which involves evaluating statistical trends from trading activities, is a fundamental tool that traders use to anticipate future price movements. In this article, we explore how, by mastering the art of reading forex charts, traders can identify patterns, determine potential entry and exit points, and enhance their overall trading strategies.
Understanding Forex Charts
A forex chart is a graphical representation of the price movements of currency pairs over a specified period. The vertical axis (y-axis) represents the price, while the horizontal axis (x-axis) denotes time. These charts provide a visual depiction of how currency prices fluctuate, allowing traders to analyze past performance and predict future trends.
Types of Forex Charts
There are several types of forex charts, each offering unique insights:
Line Charts: The simplest form, line charts connect closing prices over a set period, providing a clear view of the overall trend. They are ideal for identifying long-term trends but lack detailed information about intra-period price movements.
Bar Charts: More complex than line charts, bar charts display the opening, closing, high, and low prices for each period. Each bar consists of a vertical line (indicating the range) and horizontal ticks (representing opening and closing prices). This format offers a comprehensive view of price activity within each period.
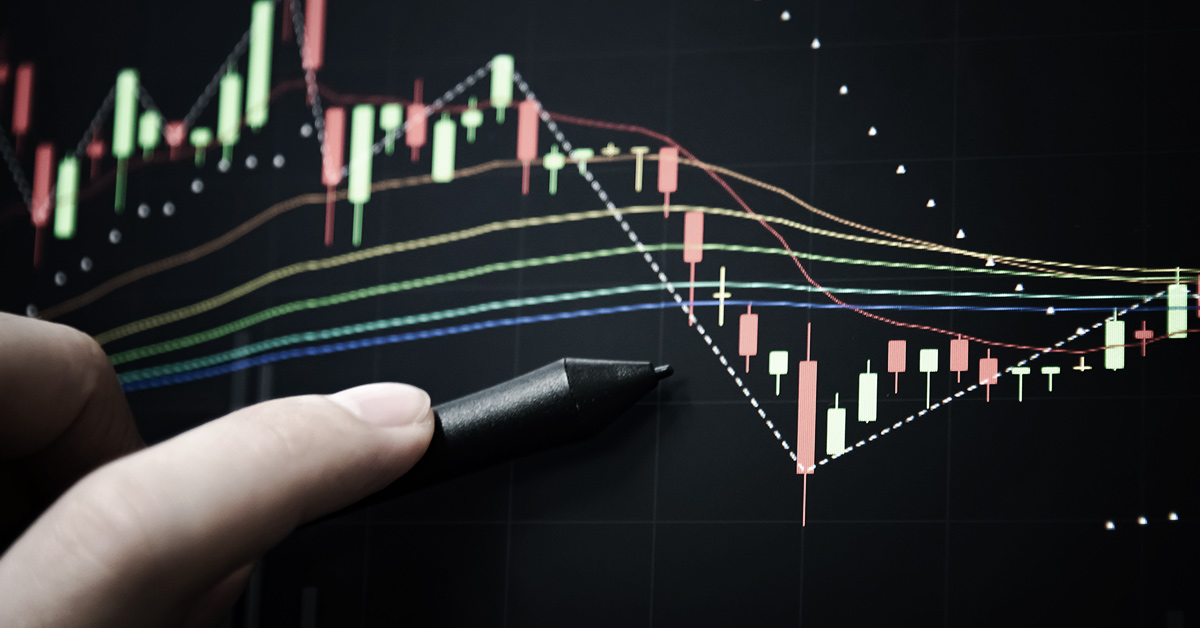
Candlestick Charts: Popular among traders, candlestick charts provide the same information as bar charts but in a more visually intuitive format. Each “candlestick” shows the opening, closing, high, and low prices, with the body color indicating whether the price moved up (typically green) or down (typically red) during the period.
Key Components of Candlestick Charts
Candlestick charts are favored for their detailed and easy-to-interpret visuals. Each candlestick comprises:
Body: Represents the range between the opening and closing prices. A filled (red) body indicates a closing price lower than the opening, while an unfilled (green) body signifies a closing price higher than the opening.
Wicks (Shadows): The lines extending above and below the body show the highest and lowest prices during the period.
Color: Typically, green indicates a bullish movement (price increase), and red indicates a bearish movement (price decrease).
Interpreting Candlestick Patterns
Candlestick patterns are formations created by one or more candlesticks and can signal potential market reversals or continuations. Some common patterns include:
Doji: A candlestick with a very small body, indicating indecision in the market. It suggests that the opening and closing prices are nearly equal.
Hammer: Features a small body with a long lower wick, indicating potential bullish reversal after a downtrend.
Shooting Star: Has a small body with a long upper wick, signaling a potential bearish reversal after an uptrend.
Recognizing these patterns can provide insights into market sentiment and potential future movements.
Time Frames in Forex Charts
Forex charts can be viewed across various time frames, from one minute to monthly intervals. The chosen time frame depends on the trader’s strategy:
Short-Term Traders (Scalpers): Often use 1-minute to 15-minute charts to capitalize on small price movements.
Medium-Term Traders (Swing Traders): Prefer 1-hour to daily charts to identify trends over several days or weeks.
Long-Term Traders (Position Traders): Utilize weekly or monthly charts to analyze long-term trends.
Selecting the appropriate time frame is crucial for aligning with trading objectives and strategies.
Incorporating Technical Indicators
Technical indicators are mathematical calculations based on price, volume, or open interest. They help traders identify trends, momentum, volatility, and other critical aspects. Common indicators include:
Moving Averages: Smooth out price data to identify the direction of the trend. For example, a 50-day moving average calculates the average closing price over the past 50 days, providing insight into the medium-term trend.
Relative Strength Index (RSI): Measures the speed and change of price movements to identify overbought or oversold conditions. An RSI above 70 suggests overbought conditions, while below 30 indicates oversold.
Moving Average Convergence Divergence (MACD): Shows the relationship between two moving averages to identify momentum and potential trend reversals.
Integrating these indicators with chart analysis can enhance decision-making and trading performance.
Support and Resistance Levels
Support and resistance levels are horizontal lines drawn on a chart to indicate price levels where the market has historically had difficulty moving above (resistance) or below (support). Identifying these levels helps traders anticipate potential reversal points and set strategic entry and exit points.
Support Level: A price level where a downtrend can be expected to pause due to a concentration of buying interest.
Resistance Level: A price level where an uptrend can be expected to pause due to a concentration of selling interest.
By analyzing these levels, traders can make more informed decisions about where to place stop-loss and take-profit orders.
Trend Lines and Chart Patterns
Trend lines are diagonal lines drawn on charts to connect successive highs or lows, indicating the direction of the trend. Chart patterns, such as head and shoulders, triangles, and flags, are formations that signal potential continuations or reversals of trends.
Uptrend Line: Drawn by connecting successive higher lows, indicating a bullish trend.
Downtrend Line: Drawn by connecting successive lower highs, indicating a bearish trend.
Recognizing these patterns and trend lines can provide valuable insights into market dynamics and potential future movements.
Conclusion
Mastering the art of reading forex charts through technical analysis is a vital skill for traders aiming to navigate the forex market effectively. By understanding various chart types, interpreting candlestick patterns, utilizing technical indicators, and identifying support and resistance levels, traders can make informed decisions and enhance their trading strategies. Continuous practice and staying updated with market developments are essential for leveraging the power of technical analysis in forex trading.
